Months ago, while planning the topics I’d cover in this newsletter through the conclusion of 2011, I had in mind to write something about search. It had been a while—almost two years at that point—since I last wrote anything about search specifically, though I had covered all sorts of things related to search many times since then, like search engine optimization and measurement. So, as is my habit, I created a text document called “search article” and began adding notes as ideas or reference material came up.
As I reviewed those notes, I realized something. Most of them were really about measurement. That’s when it hit me: Search as a topic is interesting—there’s certainly academic value in exploring how search engines work and how we use them—but for all practical purposes, there’s very little perceptual difference between search and measurement. After all, we’re not that interested in what people are searching for in general; we’re interested in what queries people use when they are searching for the kinds of products and services we offer, and especially in how they get from their search to our websites. In other words, what we’re really looking to understand is the feedback loop that exists between search engines and websites, and the key to doing that is in measurement.
In the past year, however, there has been at least one major change to how Google participates in that feedback loop—one you’ve probably noticed and have urgent questions about. I’m going to get to that. In fact, discussing that single change will be the bulk of this article. But before I get there, let me offer a prediction for the coming year that is, for better or worse, largely the result of decisions Google made in the last few months: 2012 will be the year that many of us start paying for analytics. Whether for specific web analytics applications, API integration, or AdWords, we are going to start discovering that consistent, reliable access to data and analysis is well worth budgeting for.
If you haven’t already come to that conclusion yourself, let me try to convince you…
Google has historically provided a very wide range of perspectives when it comes to search analysis. On the farthest end of the spectrum is Google Zeitgeist, a yearly anthropological analysis of the very big picture as far as search is concerned. Here you’ll see how our search queries form an index of culture, describing who we are and what we care about. Not surprisingly, you won’t see many of the keywords you care about professionally, that is unless you are a celebrity publicist. Google Trends zooms in just a bit more and evaluates individual search queries based upon volume. Again, getting too specific probably won’t be very helpful. For instance, there’s not enough volume to provide data for “website prototyping,” but there is for “web design” (trending down, by the way). Next, Google Insight can help you get a little closer to the terms you care about and see how certain search queries trend over time and geographically. For example, searches for “website prototyping” became far more relevant globally starting only in 2008—surprising, yes, but that insight helps me to get a better sense of the personas I consider when writing articles like this one. And yet, even though we’re getting closer to our daily, practical needs when it comes to understanding how search traffic corresponds to website traffic, none of these tools offers the value that Google Analytics has.
Three years ago, I wrote an article on how to use Google Analytics that has consistently been one of the most popular pieces of content on our website. That says nothing about the article’s quality, really, but everything about the demand among readers for information that might help them use this powerful tool more effectively. And powerful is really an understatement. Back then, I put it this way: “Google Analytics is, in my opinion, the most valuable application that Google has created so far.” Until very recently, I’ve stood by that statement. But Google changed something so central to the value of Analytics that I have to downgrade it just a bit. It remains a great tool, certainly, but it can no longer stand alone. I now see it as just one part of a larger, diversified analytics suite—one you’ll need to start thinking about more deeply as well as financially.
The Search to Stats Feedback Loop is Broken
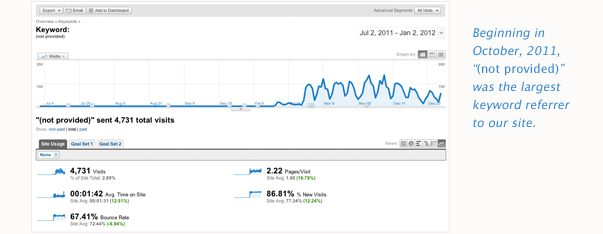
As of October, 2011, users logging in to their Google accounts were redirected, by default, to the secure (indicated by the https:// in the URL) version of Google’s services. Announced as an initiative to make search more secure (i.e. private) for users, Google began encrypting search queries submitted by users in the secure environment, which means that the keywords they searched for were no longer recorded as part of their referrer information if their search led them to your website. To be clear, this means that anyone signed in to their Google account will always be searching in a secure environment. If they open another browser and don’t sign in to their Google account but search for something using Google, that search will not be encrypted. But as you can imagine, that group is an increasingly unlikely number. There’s no way to soften the blow here. Losing access to this information is a big deal. You’ve probably already seen the results. If you log in to your Google Analytics account and take a look at the Traffic Sources report, “(not provided)”—the aggregate entry of all encrypted keywords—will be a rising star on your keywords list. For Newfangled.com, “(not provided)” is now accounting for over 20% of our incoming organic search traffic—the largest single entry on the list. Like I said, a big deal.

So why is Google doing this? They say it’s about respecting user privacy, which I’d like to take at their word, but there are definitely many benefits to Google that may or may not be the driving force behind the decision. For instance, tying all user searches to unique accounts will enable Google to create a more personalized search experience, which should lead to more committed users. Google wants you to stay, you know. And for those in marketing that can’t stand losing access to the keyword data, routing more budget to AdWords, which still offers keyword and session data, is a viable option for now. That means more revenue for Google and a deeper level of commitment from those users.
By the way, Google Webmaster Tools does still aggregate the top 1000 search queries responsible for traffic to your site over the last 30 days only, including those from users in the secure environment. So, working with that tool could be attractive to you, but my opinion is that it won’t be worth the trouble to set up and begin managing—not to preserve 30 days worth of data, anyway.
In response to all of the concern about the “(not provided)” data set, Google’s resident Analytics expert Avinash Kaushik provided a few custom reports that you can import into your analytics account to analyze it—sort of—and concludes that it’s reasonable to assume that “(not provided)” is a cross-section of your website’s overall traffic. Kaushik believes that this just stands to reason, given how secure search has been implemented across all Google Accounts. Maybe. But one could also assume a basic qualitative difference between those who use Google services and those who don’t. Why not? Or, a difference between those who bookmarked the secure version of Google over a year ago because of privacy concerns or literacy of that issue and those who are now searching secure whether they know it or not. In either case, big assumptions are being made. This approach isn’t much of a consolation.
What people really want to know is what words are initiating sessions on their websites. But that’s exactly what’s being withheld by Google and exactly what defines this new set. This new set is a black box full of words you want to know. As more and more users become part of the secure search set—which will happen—this sorta-kinda general comparative analysis (i.e. “(not provided)” vs. everyone else) will be relatively meaningless. Honestly, it already is. So, if you were hoping for a workaround, you’re out of luck.
Here’s a light hunch: Google has explained that withholding search terms was a decision they came to out of respect for user privacy. If that’s true, I can respect that, though it gets me theorizing there is certainly some kind of gradation to the nature of search queries and how private they are, and that, just like any other matter of ethics, we should continue to carefully refine our approach rather than be reactive. In the meantime, though, I have a bit of a default skepticism as far as Google’s concern for privacy goes. Sincere or not, shutting down access to keyword data definitely makes paying for AdWords more attractive, even if only on a petty cash level, which of course benefits Google substantially in the aggregate.
My bigger-and-more-prone-to-be-wrong hunch: that Google will release an enterprise-level analytics tool through which this data will be provided, though in keeping with their privacy angle, not tied to specific sessions or page views. You’ll be able to see which terms are bringing traffic to your site and score those terms on the basis of time on site, page views, bounce rate, and the like, but not necessarily see that term “X” led to a session that landed on page “X,” followed by page “X,” etc. Just a hunch.
There is No Next Google Analytics
If Google Analytics were to be discontinued completely—something I definitely don’t expect to happen—it would sting, but it wouldn’t really incapacitate anyone. In fact, there are more analytics tools today than you could possibly use. Some relatively new examples include Clicky, Woopra, Chartbeat, Mixpanel, and ShinyStat. I’ll be honest: I haven’t purchased accounts for any of these services, but on the basis of the bit of looking at them and reviews for them I did to prepare for this article, none would be a waste of your time or money at this point, especially if you’re willing to pay for the freedom to experiment with a variety of sources of analysis.
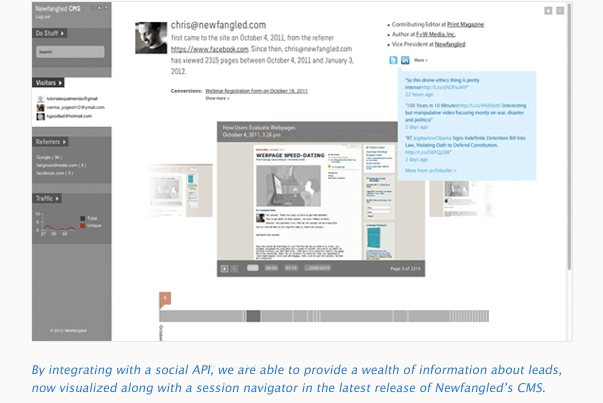
Given the availability of tools and the economic factors at play, a wise marketer would assemble a suite that includes a general-purpose analysis tool, a CMS-integrated solution using social media and keyword APIs, as well as several free tools that look at web data from different angles. As far as API’s are concerned, we made the decision this year to integrate our CMS with two in order to bolster its reporting capabilities. To preserve keyword ranking as a datapoint in our CMS dashboard, we selected an API that queries keyword ranking on the fly, which in turn lets our users enter keywords into their dashboard and track their Google ranking over time. This is something we used to be able to do using the basic Google Analytics API until last summer, when Google restricted queries for that data. Rather than give up on keyword ranking as a useful datapoint, we tracked down the best solution we could find and, yes, paid for it. To get more information on the leads generated by our content, we chose a social intelligence API that will look up email addresses and retrieve active social media profile info for those accounts, which provides us with really helpful information as we score the leads generated by our site (shown in the screengrab below). We pay for this one, too. But the value to us is clear: This kind of integration has helped us create what I sincerely believe to be one of the most forward-leaning content management systems out there. Now is the time to be creative and experimental with measurement.

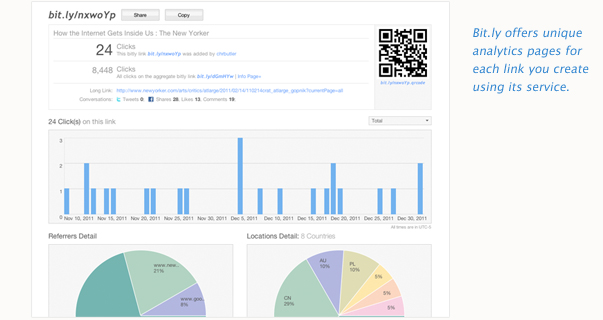
And yes, there’s free stuff still worth exploring, too. Here’s just one tiny example of a free but very unique measurement tool: Plenty of people use bit.ly to shorten URLs, especially since it integrates nicely with Tweetdeck, but many don’t know that you can get analytics on your bit.ly links simply by adding a + to the end of the URL.
With the bit.ly stats, I was able to see how many people clicked the links I created for the content included in a pet project of mine called A Year of Ideas. In a nutshell, A Year of Ideas is a yearly compilation of web content that I gather, print, and give to friends and colleagues. But online, I list out the chapters and provide links—using bit.ly—to the original content. By extracting data from the bit.ly stats too, I was able to discover that—so far—the average number of clicks has been a modest 13, with most of the clicks skewed, predictably, toward the top of the list. (In fact, the average of the top half of the list is 16, while the average of the bottom half of the list is 9.) Anyway, bit.ly’s stats are a powerful way to measure how your content is shared across the entire web, too, especially if you’re doing lots of social media promotion. For every link you create, bit.ly also connects it to an aggregate bit.ly version to show how often the content you are linking to is shared using bit.ly. That includes anyone on the web who used bit.ly to link to your content. Very cool. So, for example, I used bit.ly to link to a wonderful piece by Adam Gopnik in the New Yorker called How the Internet Gets Inside Us. Here’s the stats report for that link. My bit.ly link received 20 clicks, but the aggregate received 8,326. Of course, site-side analytics should be able to tell you how much traffic is incoming to any particular page, but the bit.ly side can help you to dig further in to the detail: when the link was created, when it was clicked, on which social media platforms the link was shared, where the users were located, and even a timeline of the shortened URL’s life so far.
To sum up, what you’ll do next will be to find a blended measurement solution, not an all-in-one.
The BIG Picture
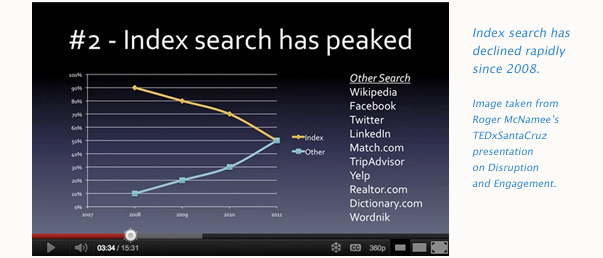
I think the bottom line here is that all of this—Google’s moves and the proliferation of other measurement tools—amounts to an indicator that our entire notion of the value of index search data will change in the not-too-distant future. In fact, it probably already has, though we’ve not cognitively caught up with our own behavior. In fact, Roger McNamee, founding partner of Elevation Partners, goes so far as to say that index search has peaked and I think his analysis is sound.
If you don’t have time to watch his entire TED talk about disruption and engagement, take it from me, he lays out a pretty solid case: First of all, Google went from powering 90% of all internet search volume 4 years ago to just under 50% today. This is an inflection point, where “other” tools like Wikipedia, Facebook, Twitter, TripAdvisor, Yelp, etc. crosses over and collectively outrank Google. This is what is depicted in the screengrab I took from McNamee’s video, above. Many of these tools have gained momentum due to the content associated with their platforms, but also because they have unique, searchable mobile applications—an important thing to note especially as only a small fraction of the overall index search activity happens on mobile devices.
This isn’t a such-and-such-is-dead announcement. It’s not that index search is going away, it’s just that its overall dominance is being eroded by a variety of other options. Just like measurement. See the connection? Our job will be to maintain flexibility and remain on the lookout for the trends behind the data we measure, as well as the best tools available to do the measuring.


