1. Insight Engine
1.1 New Account Dashboard
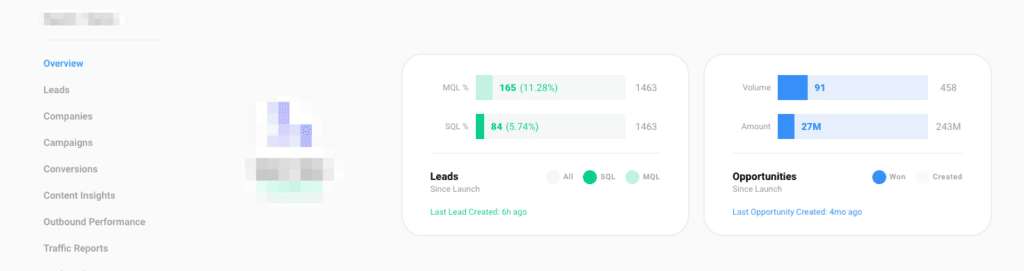
The account dashboard has been completely reworked, with a greater emphasis being placed on the performance of MQLs, SQLs, and Opportunities (if a CRM is connected).
The first row shows top-level, all-time metrics for the account.
The first box shows the total number of active leads that have been observed for this account, since the account was created. These are then compared to the percentage of these leads that have been flagged as MQLs and SQLs.
The second box shows opportunity metrics, if the account is connected to a CRM. The number and dollar amount of opportunities created since the program are show, and compared to the number and dollar amount of the opportunities won.
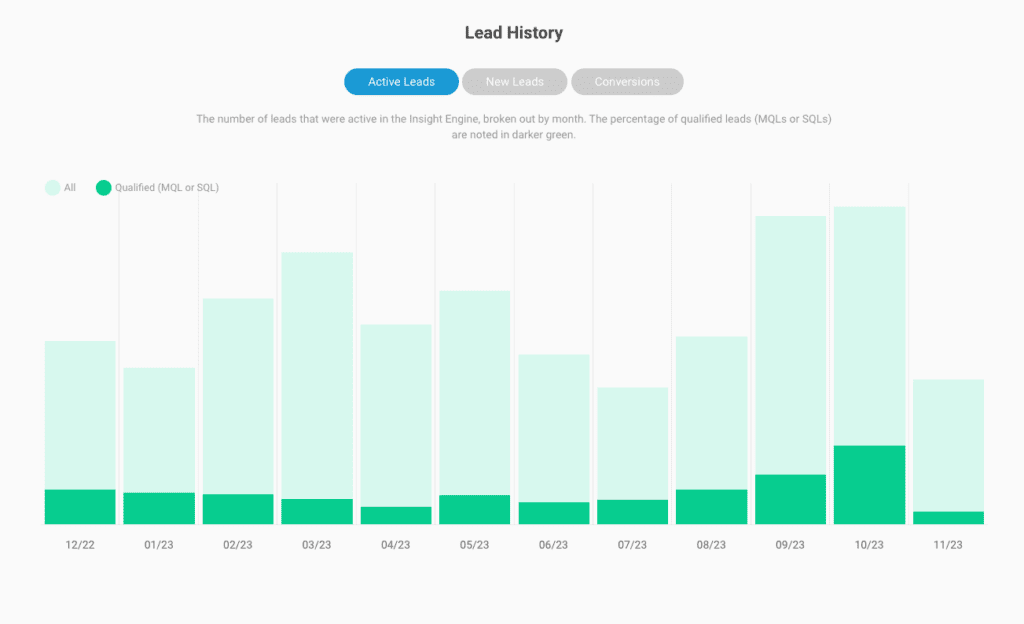
This is followed by a “Lead History” chart, which visualizes performance over the past 12 months. The chart can be adjusted to show the following three reports:
Active Leads: The number of leads that were active in the Insight Engine, broken out by month. The percentage of qualified leads (MQLs or SQLs) are noted in darker green.
New Leads: The number of leads that were seen for the first time in the Insight Engine, broken out by month. The percentage of qualified leads (MQLs or SQLs) are noted in darker green.
Conversions: The number of converting leads (leads that filled out a form), broken out by month. The percentage of qualified leads (MQLs or SQLs) are noted in darker green.
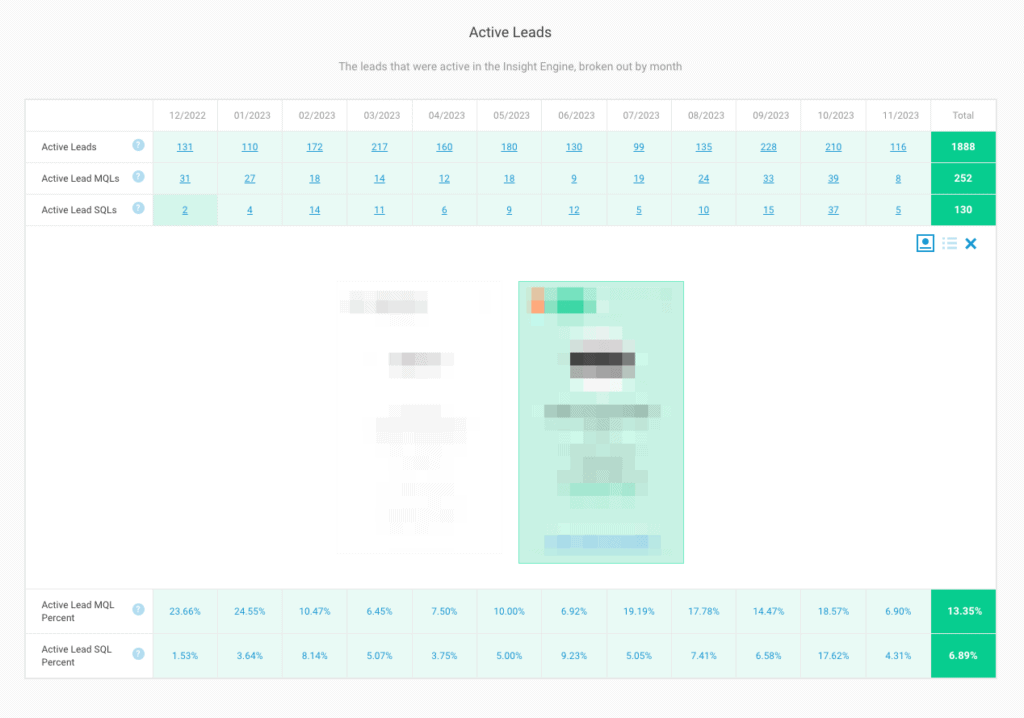
This is followed by three drilldown tables, that provide a more detailed account of the three metrics shown in the Lead History chart. Each table cell can be clicked to expand and show the specific leads for that metric in that month. The three drilldown tables are:
Active Leads: The leads that were active in the Insight Engine, broken out by month
New Leads: The new leads that were seen for the first time in the Insight Engine, broken out by month
Conversions: The activity of all conversions (form submissions), broken out by month
This is followed by three ‘Recently Active Leads’ lead card sliders. These are:
Recently Created Leads: Leads that were first active in the past two weeks
Recently Active MQLs: MQL Leads that were active in the past two weeks
Recently Active SQLs: SQL Leads that were active in the past two weeks
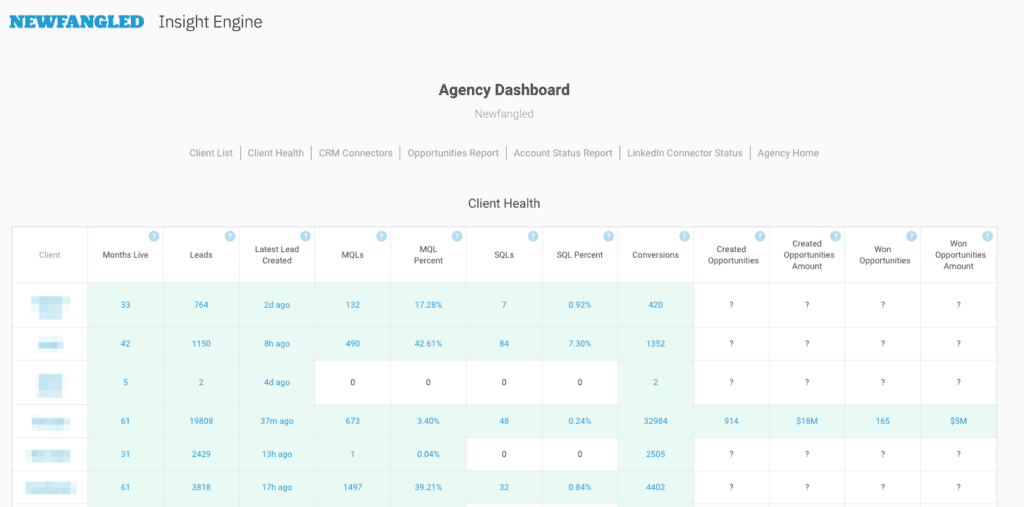
1.2 New Agency Dashboard “Client Health” report
Using the new account dashboard metrics, there is a new “Client Health” report available in the Agency Dashboard. This report will list all of the accounts managed by the agency, and elevate the following metrics for each:
Months Live: The number of months the program has been live
Leads: The total number of new leads added to the Insight Engine during the program
Latest Lead Created: When the most recent new lead was created
MQLs: The total number of MQLs added during the program
MQL Percent: The percentage of leads who became MQLs
SQLs: The total number of SQLs added during the program
SQL Percent: The total number of SQLs added during the program
Conversions: The total number of conversions received during the program
Created Opportunities: The total number of opportunities created during the program
Created Opportunities Amount: The total amount of opportunities created during the program
Won Opportunities: The total number of opportunities closed during the program
Won Opportunities Amount: The total amount of opportunities closed during the program
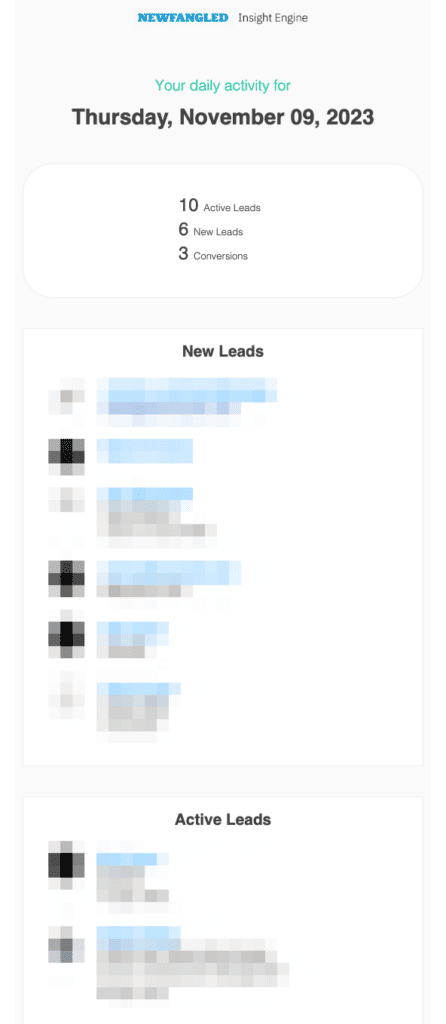
1.3. Revised Daily Activity Email
The revised Daily Activity Email now includes some metrics elevated in the new Account Dashboard.
The overview section lists the following metrics from the previous day:
- # of Active Leads
- # of New Leads
- # of Conversions
- # of Active MQLs
- # of Active SQLs
This is followed by three lists:
- A list of all New Leads, sorted by activity
- A list of all Active Leads, sorted by activity
- A list of all Conversions
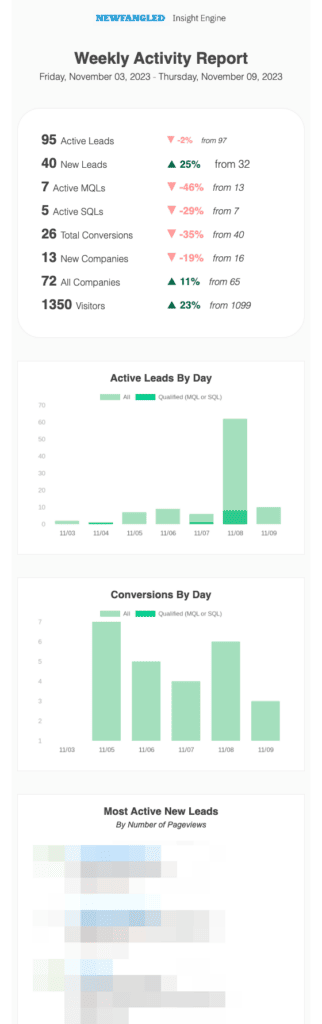
1.4 Revised Weekly Activity Email
The revised Daily Activity Email now includes some metrics elevated in the new Account Dashboard.
The overview section lists the following metrics from the previous week, as well as a percentage change vs the week prior:
- # of Active Leads
- # of New Leads
- # of Active MQLs
- # of Active SQLs
- # of Total Conversions
- # of New Companies
- # of Total Companies
- # of Visitors
This is followed by two charts:
- An Active Leads By Day chart
- A Conversions By Day chart
This is followed by five lists of the most active leads, broken out in several ways:
- Top 5 Most Active New Leads (By Number of Pageviews)
- Top 5 Most Active Leads (By Number of Pageviews)
- Top 5 Most Active Companies (By Number of Pageviews)
- Top 5 Most Active MQLs (By Number of Pageviews)
- Top 5 Most Active SQLs (By Number of Pageviews)