I have a hypothesis that our company is much like an ecosystem–comprised of many areas of unseen activity in addition to the very visible activity. With that in mind, I’ve been collecting data for the past few weeks that is a bit different from what I might normally look at (i.e. website and financial data). I want to see what unknown connections there might be between what we do intentionally and what we do unintentionally.
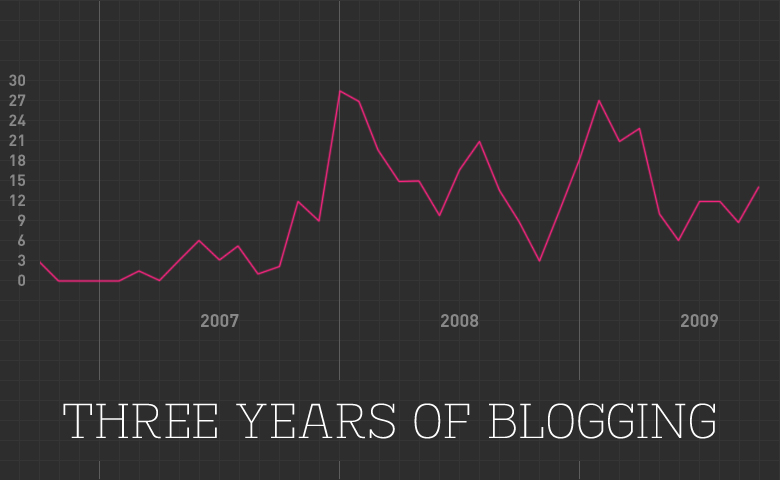
The graph above, containing one set of data from my “peripheral data collection” of late, shows the number of blog posts we’ve published since starting the Newfangled blog back in October, 2006. Throughout these three years, we’ve never had any established quota for publishing frequency, so I wondered what conclusions I might be able to make from looking at post frequency from the beginning until now. One immediate conclusion I can make is that this is not a large enough sample of data to support identifying significant cycles. There are only two full years represented, and the truth of the matter is that our blogging was fairly inconsistent during those three years for pretty discernable reasons. The first is due to population. From 2007 through 2009, we added 9 new employees to our team, all of whom have contributed to the blog. We also lost a few who blogged from time to time. The second is due to a sense of purpose. When we first started, many of our post were culturally oriented, “look-what-I-found” kinds of posts. It wasn’t really until July of 2008, when I published a post called Newfangled Blogging 2.0 that we really began to focus our efforts. In fact, July of 2008 was a time when we were focusing on defining a web content strategy in earnest, blogging being just one piece. After that, we started to plan our writing- identifying topics we wanted to see covered in the blog, making the frequency more consistent and encouraging more people to write. We’ve been moderately successful in that; our production schedule does make it a challenge to do all that we want to do. But, we’re getting the hang of it.
Note, for example, the May-June-July pattern that shows up in 2008 and repeats in 2009. That’s an interesting trend. It used to be that summers were a slower time at Newfangled. But since 2007, summers have been the opposite. They’ve been very, very busy, so I’m not surprised to see the decrease in blogging at the outset of that season. I also wonder if we’ll uncover a similar pattern in October-November-December. Time will tell.


